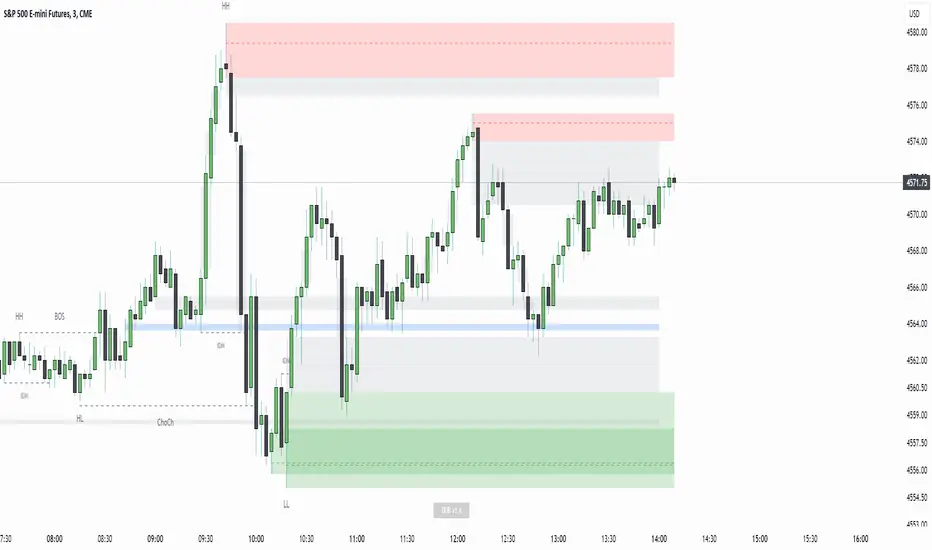
Market Structure Smart Money Concept - BOS + CHOCH + IDMThis tool is designed for traders working with Smart Money Concepts (SMC) and analyzing market structure.
Key Elements
It automatically identifies and marks:
- **BOS (Break of Structure)** – confirmed breaks signaling trend continuation
- **CHoCH (Change of Character)** – reversal points marking trend changes
- **IDM (Internal Market Structure)** – a critically important element that helps distinguish true reversals from temporary corrections
- **Inside Bars** – automatic detection of inside bars to filter out "noise"
Why IDM is Important
Traders often mistake ordinary liquidity collection for the beginning of a new trend. IDM acts as an additional filter - only after its break can we speak of a true change in market structure.
Flexible Settings
- Label sizes and colors
- Line styles
- Separate settings for shadow and body breaks
- Search period configuration for initial points (1-100% of available history)
- Option to display current structure level lines
- Information table
Main Advantages
- Clear real-time market structure visualization
- Separation of body and shadow breaks for more precise analysis
- Flexibility of use: suitable for both intraday scalping and medium-term trading
- Minimization of subjectivity through strict algorithm
- Works on any timeframe and liquid instruments
**This indicator allows you to clearly see the current market structure, quickly assess market conditions, track key turning points, identify the active trend and potential reversals.**
==================================================================================
Этот инструмент создан для трейдеров, работающих по Smart Money Concepts (SMC) и анализирующих рыночную структуру.
### Ключевые элементы
Он автоматически определяет и отмечает:
- **BOS (Break of Structure)** – подтверждённые пробои, сигнализирующие о продолжении тренда
- **CHoCH (Change of Character)** – разворотные точки, фиксирующие смену тренда
- **IDM (Internal Market Structure)** – критически важный элемент, который помогает отличить истинные развороты от временных коррекций
- **Inside Bars** – автоматическое определение внутренних баров для фильтрации "шума"
Почему IDM важен
Часто трейдеры принимают обычный сбор ликвидности за начало нового тренда. IDM действует как дополнительный фильтр - только после его пробоя можно говорить об истинном изменении структуры рынка.
Гибкие настройки
- Размеры и цвета меток
- Стили линий
- Отдельные настройки для теневых и полнотелых пробоев
- Настройка периода поиска начальных точек (1-100% от доступной истории)
- Опция отображения линий текущих структурных точек
- Информационная таблица
Основные преимущества
- Чёткая визуализация структуры рынка в реальном времени
- Разделение полнотелых и теневых пробоев для более точного анализа
- Гибкость использования: подходит как для интрадей-скальпинга, так и для среднесрочной торговли
- Минимизация субъективности через строгий алгоритм
- Подходит для любых таймфреймов и ликвидных инструментов
**Этот индикатор позволяет ясно видеть текущую рыночную структуру, быстро оценить ситуацию на рынке, отслеживать ключевые переломные моменты, определить активный тренд и возможный разворот.**
Cari dalam skrip untuk "inside bar"

LilSpecCodes1. Killzone Background Highlighting:
It highlights 4 key market sessions:
Killzone Time (EST) Color
Silver Bullet 9:30 AM – 12:00 PM Light Blue
London Killzone 2:00 AM – 5:00 AM Light Green
NY PM Killzone 1:30 PM – 4:00 PM Light Purple
Asia Open 7:00 PM – 11:00 PM Light Red
These are meant to help you focus during high-probability trading times.
__________________________________________________
2. Previous Day High/Low (PDH/PDL):
Plots green line = PDH
Plots red line = PDL
Tracks the current day’s session high/low and sets it as PDH/PDL on a new trading day
CHANGES WITH ETH/RTH
3. Inside Bar Marker:
Plots a small black triangle under bars where the high is lower than the previous bar’s high and the low is higher than the previous bar’s low (inside bars)
Useful for spotting potential breakout or continuation setups
4. Vertical Time Markers (White Dashed Lines)
Time (EST) Label
4:00 AM End of London Silver Bullet
9:30 AM NYSE Open
10:00 AM Start of NY Silver Bullet
11:00 AM End of NY Silver Bullet
11:30 AM (Customizable Input)
3:00 PM PM Killzone Ends
3:15 PM Futures Market Close
7:15 PM Asia Session Watch

Candle Range Detector by TradeTech AnalysisCandle Range Detector by TradeTech Analysis
This advanced indicator identifies and visualizes price compression zones based on inside bar formations, then tracks how price behaves around those zones — offering valuable insights into liquidity sweeps, range expansions, and trap/mitigation behavior.
The script builds upon the foundational concept of range-based price action, commonly used by institutional traders, and adds automation, mitigation tracking, and sweep detection to map how price reacts around these critical ranges.
🔍 How It Works:
• Range Formation: A new range is detected when the current candle forms entirely within the high and low of the previous candle (i.e., an inside bar). This behavior often indicates price compression and potential breakout zones.
• Range Extension: Once a range is confirmed, the script projects upper and lower boundaries (using either a percentage-based multiplier or Fibonacci log extension), providing context for expected breakout zones.
• Mitigation Tracking: The script continuously monitors whether price breaks above or below the projected extensions, marking that range as mitigated — useful for confirming whether liquidity was absorbed.
• Sweep Detection: If price re-visits a mitigated zone and shows signs of a liquidity sweep (via wick + close behavior), the indicator triggers visual sweep labels and optional alerts.
🧠 Optional Visual Enhancements:
• Highlight range-forming candles with light blue background (toggle on/off)
• Midpoint dotted line for symmetry analysis
• Labels for “Range High” and “Range Low” for visual clarity
• Dynamic box drawing that adapts upon mitigation or continuation
⚙️ Customizable Features:
• Choose between Normal and Fibonacci-based detection modes
• Toggle visibility of range boxes, extension lines, and sweep markers
• Configure sweep alerts, mitigation window size, and visual transparency
⸻
🧪 Use Cases
• Identify consolidation zones before major price moves
• Confirm liquidity sweeps for entry/exit traps
• Visualize and test mitigation behavior of past zones
• Combine with Order Flow or Volume Profile tools to enhance context
⸻
⚠️ This is a fully original implementation that goes beyond classical inside-bar scanners by incorporating mitigation, extension projection, and liquidity sweeps — making it a powerful tool for intraday, swing, and even Smart Money-based trading setups.

Candlestick PatternsThis versatile candlestick patterns indicator combines traditional pattern recognition with trend detection and advanced alerting capabilities. It identifies key candlestick formations while validating them against market context through trend analysis.
### Features
🎯 Pattern Detection:
• Morning Star & Evening Star
• Hammer & Inverted Hammer
• Hanging Man
• Shooting Star
• Inside Bar
📈 Smart Trend Detection:
• Multiple methods available:
- EMA (14, 28)
- SMA (50, 200)
- ZigZag
- Combined methods
- No trend detection option
🎨 Visual Signals:
• Clear up/down arrows
• Pattern labels with tooltips
• Optional ZigZag visualization
• Color-coded inside bars
⚡ Advanced Alerts:
• JSON-formatted alerts with complete market data:
- OHLCV data
- Pattern information
- Market context
- Time and symbol details
• Standard TradingView alerts
• Custom alert messages
• Token-based authentication
### Settings
▶️ ZigZag Parameters:
• Depth: Controls sensitivity
• Deviation: Fine-tunes pattern detection
• Backstep: Adjusts repainting behavior
• Visual customization options
▶️ Pattern Detection:
• Morning/Evening Star thresholds
• Hammer pattern sensitivity
• Inside bar visualization
▶️ Trend Detection:
• Multiple methods to choose from
• Combinable indicators for better accuracy
▶️ Alert Configuration:
• Customizable JSON template
• Token authentication
• Complete market data output
### How to Use
1. Add indicator to your chart
2. Choose preferred trend detection method
3. Adjust pattern parameters if needed
4. Set up alerts with your JSON template
5. Monitor for validated patterns
### Trading Tips
• Wait for pattern confirmation with trend alignment
• Use support/resistance validation
• Combine with other technical indicators
• Consider volume analysis
• Use alerts for automated trading systems
### Disclaimer
This indicator is for educational and informational purposes only. Always perform your own analysis and validation before trading.
Good luck trading! 📈
#patterns #candlesticks #technical #alerts #trading #strategy

Al Brooks - SuiteThis indicator is designed to identify some key terms and methodologies inspired by Al Brooks price action. It helps trades to easy recognize for example i/ii/iii patterns or shaved bars defined in his books.
i/ii/iii : Single to triple inside bars. Every bar an inside bar to the previous. This can indiciate a potential contination or reversal pattern. (marked with "i")
o/oo/ooo : Single to triple outside bars. Not defined by Al Brooks, but could be an interesting area to develop a strategy. (marked with "o")
Shaved bar : A bar with little or no tail/wick on one or both sides. It can indicate strong directional movement or momentum. (marked with "s"
The timeframe is not important for the validation of the patterns.

SMC Fake Zones + InsideBarThis indicator is useful for whom trade with "Smart Money Concept (SMC)" strategy.
It helps SMD traders to identify fake or weak zones in the chart, So they can avoid taking position in this zones.
This indicator marks "Asia session" as well as "London and New York's Lunch Time (one hour before London and NY session starts)" zones.
It also marks Inside Bar candles which SMC trades consider as order flow. You can mark every Inside Bar or only those with opposite color via setting options.
*** As we know in SMC rules
1- Supply and Demand zones in "Asia session and Lunch Times" are fake zones for SMC trading and price will engulf them in most of times.
2- "Asia session high and low" has huge liquidity and usually price sweep that in London session.
This indicator will helps traders to visually identify those Fake zones and Asia session liquidity.
* You can change session times based on your time zone in settings.
* You can set options to show all Inside Bars or only with Opposite color in settings.

Displacement Order Blocks ~ DOB [Liquidity_Pro]Displacement Order Blocks (DOB)
This indicator shows order blocks with displacement (FVG required) and leans heavily on ICT’s generous and insightful teachings to define midlines for FVG, IFVG, and order blocks. The market structure definitions follow TradingHub’s (TH) rules filtering out inside bars.
It offers alerts for price in order block, liquidity sweep, break of structure (BOS), change of character (CHoCH), and inducement (IDM).
The TH model was chosen because it's programmatic allowing clear structure definitions that allow us to mark inducements (S/O to @albatherium for publishing the first TH market structure indicator).
TH’s Single Candle Order Block (SCOB) rules have also been helpful in refining order block definition, for example in the Transfer case. ICT fans will see when back testing this, that it moves the focus closer to the FVG.
In developing this indicator, we've tried to offer great aesthetic flexibility, to keep the chart uncluttered and to avoid exceeding Trading View’s limitations on boxes and lines. It's also configured to work reasonably well on both light and dark background charts:
We hope this indicator can serve as a teaching tool for ICT’s price action insights and SMC market structure concepts. For this, we've included optional labels for various order block types:
I = inside bar. The bars that follow the order block have been ignored – you will see the number of ignored bars shown after a hyphen. The idea is that inside bars fall in the shadow of a more important candle and can’t be relied on for defining a trade.
S = standard case. The order block candle takes liquidity from the previous candle and is followed immediately after by an FVG on the next candle. This differs technically from the ICT “last down-close/last up-close” order block concept. In practice, this choice has very little impact on ICT trading, because the ICT trader is entering on the FVG anyway.
T = transfer case. This is an order block that has been transferred from the candle that takes liquidity to the candle just prior to the FVG. When you back test this, you will see it is a high probability choice.
TZ = tweezer. This is an option you can turn off that fills a hole in TH teachings. It bypasses the requirement for an order block to take liquidity from the previous candle in the case of equal h/ls. The result is that you will find 2 candle order blocks with equal highs and lows (also known as tweezer tops/bottoms) show on your chart. You will note that every tweezer is a wick on a higher timeframe.
W = wick. this is a big wick candle that we call an order block without requiring an FVG. The presumption is that the displacement is contained within the wick itself on a lower timeframe.
* Asterisk denotes an extreme order block.
Finally, we trade with this indicator (using it together with our Daye Quarterly Theory ~ DQT free indicator, taking trades when price reaches an extreme FVG or order block during a Q2 manipulation).
We will continue developing it along with other indicators we have not yet published. So please boost if you like this and follow us for updates. Also please let us know what new features you would like to see.
UDI barCandle has been divide into 3 types up bar, down bar and inside bar,
These bar classified comparing previous candle high low to current candle close.
This method used to ride the trend without exiting position.
We can use this candle color as a stop loss and take profit.
Previous candle H&L Vs Cur. Candle Close
I
U
D
------------------------
I - Inside Candle
U - Up Candle
D - Down Candle

Quantifiable Broadening Formations [STAT TRADING]Broadening Formations v4
━━━━━━━━━━━━━━━━━━━━━━━━━━━━━━━━━━━━━━━━━━━━━━━━━━━━━━━━━━━━━━━━━━━━━━━━━━━━━━━
OVERVIEW
Automatically identifies and draws Broadening Formations — expanding price structures that reveal where the market is auctioning both higher and lower to find fair value.
This indicator uses a quantifiable, rule-based approach to detect expansion patterns and dynamically tracks the evolution of price ranges in real-time. No subjective drawing required — the indicator handles everything automatically.
━━━━━━━━━━━━━━━━━━━━━━━━━━━━━━━━━━━━━━━━━━━━━━━━━━━━━━━━━━━━━━━━━━━━━━━━━━━━━━━
FEATURES
▸ Bar Classification System
Each bar is labeled based on its relationship to the previous bar:
1 = Inside Bar — Range contraction, price stayed within prior bar
2u = Trending Up — Higher high AND higher low
2d = Trending Down — Lower high AND lower low
3 = Outside Bar — Expansion, higher high AND lower low in single bar
C3 = Composite 3 — Multi-bar expansion pattern (2d→2u or 2u→2d completing the range)
Color coding helps identify conviction:
• Green = Bullish structure with bullish close
• Red = Bearish structure with bearish close
• Orange = Conflicted (structure and close disagree)
• Yellow = Outside Bar (3)
• Purple = Composite 3 (C3)
▸ Automatic Formation Detection
The indicator detects when price proves it can take both sides of a range, then:
• Draws dynamic upper and lower boundary lines
• Extends lines forward as projected support/resistance
• Updates the formation in real-time as price makes new highs or lows
• Detects breakouts when price closes through boundaries with conviction
▸ Support/Resistance Test Dots
Visual markers show when price tests the formation boundaries:
• Red dot at high = Price wicked into upper resistance but closed below (failed test)
• Green dot at low = Price wicked into lower support but closed above (held support)
These dots help you see where the market is probing the boundaries before a decisive move.
▸ Breakout & Reclaim Detection
Clear labels mark key events:
• BREAKOUT ↑ = Close above upper boundary (bullish break)
• BREAKOUT ↓ = Close below lower boundary (bearish break)
• RECLAIM ↑ = Failed breakdown, price recovered back into range
• RECLAIM ↓ = Failed breakout, price fell back into range
Reclaims are powerful signals — failed breakouts often lead to strong moves in the opposite direction. The formation automatically expands to include the failed move.
▸ Sub-Formations (Internal Triangles)
White lines show nested formations within larger structures. These internal patterns can provide earlier signals before the major formation resolves.
Sub-formations only appear when they are truly internal to the parent (not touching parent boundaries).
▸ Formation Labels
Each formation is labeled at its trigger point:
• 3 = Triggered by outside bar
• C3 = Triggered by composite pattern
• R1, R2... = Number of reclaims (e.g., "3 R2" = outside bar trigger with 2 reclaims)
━━━━━━━━━━━━━━━━━━━━━━━━━━━━━━━━━━━━━━━━━━━━━━━━━━━━━━━━━━━━━━━━━━━━━━━━━━━━━━━
SETTINGS
Show Bar Classification Labels Display 1/2u/2d/3/C3 below each bar
Detect Composite 3s Identify multi-bar expansion patterns
Show Sub/Internal Formations Display nested formations in white
Show Support/Resistance Test Dots Mark boundary tests with colored dots
Show Breakout/Reclaim Labels Label breakouts and reclaims
Major BF Line Color Color for primary formation lines
Sub BF Line Color Color for nested formation lines
Line Width Thickness of formation lines
Bars to Project Forward How far to extend lines into the future
━━━━━━━━━━━━━━━━━━━━━━━━━━━━━━━━━━━━━━━━━━━━━━━━━━━━━━━━━━━━━━━━━━━━━━━━━━━━━━━
ALERTS
Set alerts for key events:
• Outside Bar (3) — Single-bar expansion detected
• Composite 3 (C3) — Multi-bar expansion pattern detected
• New BF Started — New broadening formation triggered
• BF Break — Price closed through formation boundary
• BF Reclaim — Failed breakout, formation continues with expanded range
━━━━━━━━━━━━━━━━━━━━━━━━━━━━━━━━━━━━━━━━━━━━━━━━━━━━━━━━━━━━━━━━━━━━━━━━━━━━━━━
HOW TO USE
Understand your position:
Are you near the upper boundary, lower boundary, or mid-range? Context matters.
Watch for closes, not wicks:
Wicks test levels. Closes show conviction. The indicator only triggers breakouts on closes through the boundary.
Pay attention to reclaims:
A break that fails and reclaims often leads to an aggressive move the other direction. The "R" count on the label shows how many times this has happened.
Use test dots for entries:
Multiple red dots at resistance followed by a green bar = potential short setup. Multiple green dots at support followed by a red bar = potential long setup.
Sub-formations give early signals:
When an internal triangle breaks, it can front-run the larger formation's move.
━━━━━━━━━━━━━━━━━━━━━━━━━━━━━━━━━━━━━━━━━━━━━━━━━━━━━━━━━━━━━━━━━━━━━━━━━━━━━━━
NOTES
• Works on all timeframes and instruments
• Lines update dynamically as new bars form
• Historical formations are preserved on the chart
• Composite 3s (C3) are shown in purple to distinguish from single-bar triggers
• Best used to understand current market structure — combine with your existing strategy for entries
━━━━━━━━━━━━━━━━━━━━━━━━━━━━━━━━━━━━━━━━━━━━━━━━━━━━━━━━━━━━━━━━━━━━━━━━━━━━━━━
Objective structure. No guesswork.
p.s This is a public version in a different language than our true BF identification algorithm. There will be some bugs and it is unlikely we will fix it in the near future.

NS ND - EVR - Daily Bias - TRFxVolume & Price Action Signals
What It Does
Combines three proven trading methodologies: Effort vs Result (EVR), No Supply/No Demand (NS/ND), and Daily Bias tracking for intraday traders.
Features
Effort vs Result (EVR)
- **Bullish**: Green triangle below bar when price sweeps previous low with high volume and significant wick
- **Bearish**: Red triangle above bar when price sweeps previous high with high volume and significant wick
- Identifies potential reversals where volume doesn't match price movement
No Supply / No Demand (NS/ND)
- **No Demand (Red dot)**: Up-candle with declining volume - buyers weakening
- **No Supply (Green dot)**: Down-candle with declining volume - sellers weakening
- Grey dots = unconfirmed, colored dots = confirmed within lookahead period
- Based on Volume Spread Analysis (VSA) principles
Daily Bias Label
Top-right corner shows market direction:
- **BULLISH ↑** - Closed above Previous Day High
- **BEARISH ↓** - Closed below Previous Day Low
- **BULLISH/BEARISH REV** - Swept level but closed back inside
- **RANGE ↔** - Trading between PDH/PDL
## Settings
- **EVR**: Toggle on/off, volume multiplier, wick %, inside bars, transparency
- **NS/ND**: Toggle on/off, lookahead bars (default: 10)
- **Daily Bias**: Toggle label display
## Best For
✓ Intraday trading (1m-1h timeframes)
✓ Reversal setups
✓ Volume analysis
✓ Confluence trading (all signals align)
How to Use
1. Enable components you want (all can be toggled independently)
2. Trade EVR signals in direction of Daily Bias
3. Look for NS/ND confirmation at key levels
4. Wait for colored dots (confirmed signals) over grey (unconfirmed)
**Note**: Works on intraday timeframes only. NS/ND signals may repaint during confirmation period.

MMM MARKET CHAOS TO CLARITY INTELLIGENCE @MaxMaserati# MMM MARKET CHAOS TO CLARITY INTELLIGENCE
## Overview
The MMM MARKET CHAOS TO CLARITY INTELLIGENCE (MMM AI Pro) by MaxMaserati is a sophisticated multi-factor analysis tool that provides comprehensive market insights through a unified dashboard. This system integrates several proprietary components to detect market conditions, trends, and potential reversals.
At its core, this indicator is designed to bring clarity to market complexity by identifying meaningful patterns and establishing order within what often appears as random market chaos
The MMM Intelligence Matrix accomplishes this through its multi-layered approach:
- The MMPD system quantifies market conditions on a clear 0-100 scale, transforming complex price movements into actionable premium/discount levels
- The proprietary candle analysis (MMMC Bias) identifies specific patterns with predictive value
- The integration of volume, momentum, and multi-timeframe analysis creates a comprehensive market context
- The Hot/Cold classification system helps traders distinguish between sustainable moves and overextended conditions
What makes this indicator particularly valuable is how it synthesizes multiple technical factors into clear visual signals and classifications. Instead of leaving traders to interpret numerous conflicting indicators, it presents an organized dashboard of market conditions with straightforward action zones.
## Core Components
### MMPD (Max Maserati Premium and Discount)
- Normalizes price movement on a 0-100 scale:
- **Premium (>50)**: Bullish conditions
- **Discount (<50)**: Bearish conditions
- **Extreme values (>90 or <10)**: Potential reversal zones
### MMMC (Max Maserati Model Candle) Bias
- Analyzes candle patterns to predict behavior:
- **Bullish/Bearish Body Close**: Price closes beyond previous candle's high/low
- **Bullish/Bearish Affinity**: Shows tendency toward continuation
- **Seek & Destroy**: Tests previous levels then breaks in new direction
- **Close Inside**: Closes within previous candle's range with directional bias
- **Plus/Minus**: Indicates slight tendency toward bulls/bears
### PC Strength (Previous Candle Strength)
- Measures percentage power of recent candlesticks
- Analyzes strength across multiple previous candles (PC1, PC2, PC3)
### MVM (Market Volatility Momentum)
- Adaptive moving averages system analyzing multiple timeframes:
- **Short context (8 bars)**: Immediate direction
- **Medium context (21 bars)**: Intermediate validation
- **Long context (55 bars)**: Primary trend confirmation
- **Higher timeframe**: Additional confirmation
### Volume Intelligence System
- Adaptive algorithm comparing current volume to 20-period average
- Identifies significant volume events and thresholds
### Hot/Cold Momentum Classification
- **Strong Bullish/Bearish (Hot)**: Potentially overextended
- **Strong Bullish/Bearish (Cold)**: Strong with room to continue
- **Bullish/Bearish Momentum**: Clear directional bias
- **Mild Bullish/Bearish**: Weak directional bias
### HVC (Highest Volume Candles) Detection
- Triangle markers and sequential stars indicate significant volume-confirmed movements
- Signals potential trend changes and continuation setups
## Dashboard Interface
The customizable dashboard displays:
1. **MMMC Bias**: Candle pattern analysis and direction
2. **Delta MA**: Buy/sell pressure with directional arrows
3. **PC Strength**: Percentage strength of previous candles
4. **Current Trend**: Overall market bias state
5. **MMPD Bias**: Premium/discount context
6. **Short/Medium/Long Term**: Price change percentages
7. **Trend Quality**: Reliability rating
8. **Volume Strength**: Classification (High/Medium/Low)
9. **MMPD Values**: Current level with direction indicator
10. **HTF Trend**: Higher timeframe confirmation
11. **Trend Strength**: Overall momentum measurement
12. **Action Zone**: Trading zone classification
13. **Momentum Strength**: Hot/Cold status
## MMPD Value Classifications
- **EXTREME PREMIUM (>90) ⚠️**: Extremely overbought
- **HIGH PREMIUM (80-90) ↗**: Strong bullish (caution)
- **PREMIUM (65-80) ↗**: Healthy bullish zone
- **LIGHT PREMIUM (50-65) →**: Mild bullish territory
- **LIGHT DISCOUNT (35-50) →**: Mild bearish territory
- **DISCOUNT (20-35) ↘**: Healthy bearish zone
- **HIGH DISCOUNT (10-20) ↘**: Strong bearish (caution)
- **EXTREME DISCOUNT (<10) ⚠️**: Extremely oversold
## Action Zone Classifications
- **MASSIVE BUY/SELL ZONE ★★★**: Very strong bias (Strength >5.0)
- **STRONG BUY/SELL ZONE ★★**: Strong bias (Strength >3.0)
- **MEDIUM BUY/SELL ZONE ★**: Moderate bias (Strength >2.0)
- **LIGHT BUY/SELL ZONE ⋆**: Mild bias (Strength >1.0)
- **SUPER LIGHT BUY/SELL ZONE ·**: Weak bias (Strength <1.0)
- **NEUTRAL ZONE**: No clear directional bias
## Visual Signals
1. **Triangle Markers**: HVC system directional signals (up/down)
2. **Sequential Stars (★)**: Advanced confirmation signals following trend changes
3. **High Volume Highlighting**: Optional candle emphasis for volume events
## Entry Conditions
### Strong Buy Setup
- MMPD Values: PREMIUM or LIGHT PREMIUM
- Hot/Cold Status: "⚠️ Strong Bullish (Cold)" or "↗️ Bullish Momentum"
- Action Zone: MASSIVE or STRONG BUY ZONE
- Volume Strength: High or Medium
- Current Trend: Strong Bullish or Bullish
### Strong Sell Setup
- MMPD Values: DISCOUNT or LIGHT DISCOUNT
- Hot/Cold Status: "⚠️ Strong Bearish (Cold)" or "↘️ Bearish Momentum"
- Action Zone: MASSIVE or STRONG SELL ZONE
- Volume Strength: High or Medium
- Current Trend: Strong Bearish or Bearish
## Exit Conditions
### Exit Long Positions When
- Hot/Cold Status changes to "⚠️ Strong Bullish (Hot)" or "↘️ Bearish Momentum"
- MMPD Values shows EXTREME PREMIUM or HIGH PREMIUM
- Action Zone changes to NEUTRAL ZONE or any SELL ZONE
- Current Trend shows "Bearish Reversal" or "Exiting Overbought"
### Exit Short Positions When
- Hot/Cold Status changes to "⚠️ Strong Bearish (Hot)" or "↗️ Bullish Momentum"
- MMPD Values shows EXTREME DISCOUNT or HIGH DISCOUNT
- Action Zone changes to NEUTRAL ZONE or any BUY ZONE
- Current Trend shows "Bullish Reversal" or "Exiting Oversold"
## Position Sizing Guidelines
- **Full Position (100%)**: Action Zone ★★★/★★, normal momentum, High volume
- **Reduced Position (50-75%)**: "Cold" signal, Action Zone ★, Medium volume
- **Small Position (25-50%)**: Action Zone ⋆, Medium/Low volume, mixed signals
- **No Position**: "Hot" signal, NEUTRAL zone, Low volume
## Special Trade Setups
### Reversal Setups
- **Bullish Reversal**: Transition from EXTREME DISCOUNT, Hot→Cold change, emerging buy signal, high volume
- **Bearish Reversal**: Transition from EXTREME PREMIUM, Hot→Cold change, emerging sell signal, high volume
### Continuation Setups
- **Bullish Continuation**: PREMIUM range, "Cold" signal, strong volume, timeframe alignment, clear Action Zone
- **Bearish Continuation**: DISCOUNT range, "Cold" signal, strong volume, timeframe alignment, clear Action Zone
## Sequential Stars System
- **Sequential Buy Signal**: Bullish star after bearish trend, volume confirmation
- **Sequential Sell Signal**: Bearish star after bullish trend, volume confirmation
## Best Practices
- Check multiple timeframes (prioritize when all align)
- Validate with volume (High >2.5x, Medium >1.2x)
- Assess trend quality (Strong ★★★, Confirmed ★★, Warning ⚠, Transition ↕)
- Handle inside bars/consolidation with additional confirmation
## Technical Considerations
- Based on closed candles for calculations
- Requires reliable volume data
- Higher sensitivity settings may produce more frequent signals
- Extreme readings indicate potential turning points
- Sequential stars require proper trend changes for activation
## Indicator Applicability
- **Markets**: Forex, Crypto, Stocks, Futures, Commodities
- **Timeframes**: 1H+ recommended, 4H/Daily for primary analysis
*Intended for use with the full MMM system. Trading decisions require proper knowledge and risk management.*

3-1 Setup Detector (Multi-Timeframe)📌 3-1 Setup Detector (Multi-Timeframe) – Description
The 3-1 Setup Detector (Multi-Timeframe) is a powerful price action indicator designed for The Strat trading method. It automatically detects 3-1 setups, where an outside bar (3) is followed by an inside bar (1), signaling potential breakout opportunities.
🔥 Key Features:
✅ Multi-Timeframe Support – Works on 1H, 2H, 3H, 4H, 6H, 12H, Daily, 2D, 3D, Weekly, 2W, 3W, Monthly, Quarterly
✅ Real-Time Alerts – Get notified when a 3-1 setup forms
✅ Easy Visualization – Plots markers on the chart for quick recognition
✅ Customizable Timeframe – Select a specific higher timeframe for confirmation
📊 How It Works:
Identifies an outside bar (3), where the high is higher and the low is lower than the previous bar.
Detects an inside bar (1), where the high is lower and the low is higher than the previous bar.
If a 3-1 sequence occurs, the indicator marks the setup on the chart and triggers an alert.
🎯 Trading Applications:
Breakout Strategy: Trade breakouts when the 3-1 setup forms near key levels.
Reversal Signals: Use in combination with support/resistance for confirmation.
Multi-Timeframe Analysis: Detect setups on higher timeframes while trading lower ones.
🚀 Perfect for traders who use The Strat method and want real-time, high-probability trade setups across multiple timeframes!

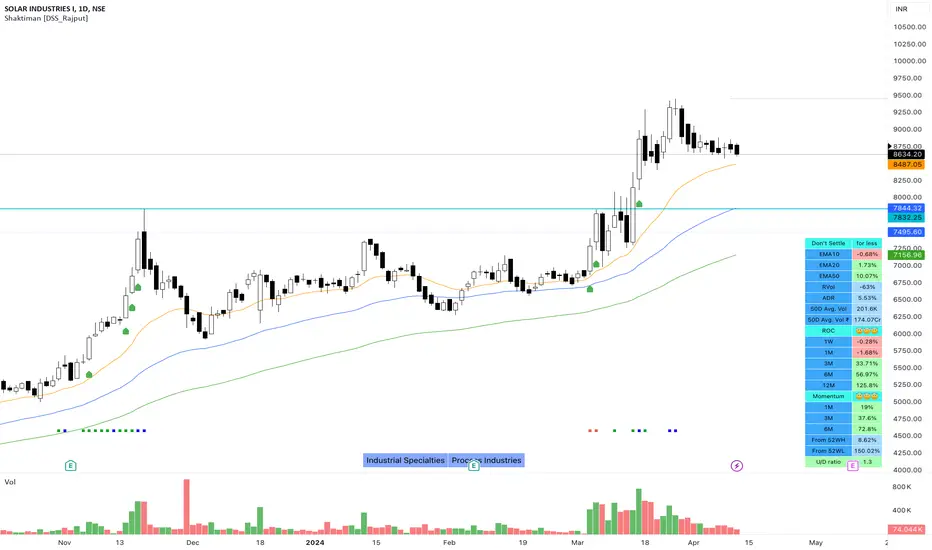
Shaktiman [DSS_Rajput]I'm a Momentum Trader, following the Indian markets, Mark Minervini and William O'Neil follower.
User Settings
Inputs tab
EMA option for Table - It compares the current price of the symbol to its key EMA's and calculates the rate of return to make it easier to track the performance of the symbol. It Helps you to identify how far the price is from its Key EMA's
ADDITIONAL TABLE DATA - It will allow you to use multiple performance data sets with your set of customizable inputs (You can change periods as per your requirements)
Show Inside Bar (IB): Allows you to add Inside Bar on your chart
Show NR4 (Narrow Range): Allows you to add an NR4 bar on your chart
Show INR7(Narrow Range): Allows you to add NR7 Bar on your chart
Distance_From_EMA_Table: Allows you to enable/disable the price difference with its key EMA's table.
ROC_Table: It compares the current price of the symbol to its past price and calculates the rate of return to make it easier to track the performance of the symbol.
Note that the Performance sidebar is not updated in real-time, while this indicator is, so on real-time charts.
The formula of the calculation is (Current value - Past value) * 100 / Past value, where Past value is: 1W, 1M, 3M, 6M, 1Y
Momentum_Table: It compares the current price of the symbol to its past lowest price of that period and calculates the %Gain of the symbol from the low of that period
Power_Play_Candidate: It will show the power play candidate, similar to IBD, It merely qualifies for Power_Play.
You need to wait for the Right Entry point. It will give you 8 Week Range.
According to IBD, it should move 100%+ in less than 8 weeks. You can modify your criteria by changing the percentage gain.
U/D Ratio: IBD defines the U/D ratio as "A 50-day ratio that is derived by dividing total volume on up days by the total volume on down days.
A ratio greater than 1.0 implies positive demand for a stock"
UpVol criteria: close>open and vice versa for DownVol
Rvol (Relative Vol): Percentage volume change (compared to daily average volume)
ADR : It allows you to add the Average Daily Range to the table.
Show 50D Avg. Vol & Avg. Vol rupee: It allows you to add 50-Day Avg. Vol and 50-Day Avg. Vol rupee.
Show_Bull_Snort: Allows you to add bull snort to your chart and style the bar.
Bull Snort is the work of Oliver Kell. For more info about Oliver kell, check youtube videos of Oliver Kell.
Normal Moving Average: Plot 4 Simple, Exponential, and Weighted Moving Averages. (You can choose an option between EMA/SMA/WMA)
Fixed Moving Average : Plot 4 Simple, Exponential, and Weighted Moving Averages. (You can choose an option between EMA/SMA/WMA)
Plus Point: It will not change its value when you switch to a different timeframe. Let's say you applied Fixed Daily 20MA, on the intraday chart.
It will not change its value and It will give you much more clarity that, from where the price is bouncing from 20MA. Explore it (You will definitely love it!)
Fixed Moving Average : Plot 2 Simple, Exponential, and Weighted Moving Averages. (You can choose an option between EMA/SMA/WMA)
Plus Point: It will not change its value when you switch to a different timeframe. (It's like Plotting 10 Week Line on Daily Chart & Intraday Charts)
Numbers of weeks to show High & Low: It will add data to the tables and also add 52 weeks of High & Low lines on the charts.
(Number of weeks is customizable, you can change as per your requirements.)
Style tab
You can modify the style and color of any of the inputs except table color.
Conclusion
If you like this script, click on Add to favorite indicators, so that you can easily add this indicator from your favorites tab right away.
Hope you find this useful. Please leave any questions you have in the comment section and I'll be happy to answer them.
Thanks!
DCA Percent SignalOverview
The DCA Percent Signal Indicator generates buy and sell signals based on percentage drops from all-time highs and percentage gains from lowest lows since ATH. This indicator is designed for pyramiding strategies where each signal represents a configurable percentage of equity allocation.
Definitions
DCA (Dollar-Cost Averaging): An investment strategy where you invest a fixed amount at regular intervals, regardless of price fluctuations. This indicator generates signals for a DCA-style pyramiding approach.
Gann Bar Types: Classification system for price bars based on their relationship to the previous bar:
Up Bar: High > previous high AND low ≥ previous low
Down Bar: High ≤ previous high AND low < previous low
Inside Bar: High ≤ previous high AND low ≥ previous low
Outside Bar: High > previous high AND low < previous low
ATH (All-Time High): The highest price level reached during the entire chart period
ATL (All-Time Low): The lowest price level reached since the most recent ATH
Pyramiding: A trading strategy that adds to positions on favorable price movements
Look-Ahead Bias: Using future information that wouldn't be available in real-time trading
Default Properties
Signal Thresholds:
Buy Threshold: 10% (triggers every 10% drop from ATH)
Sell Threshold: 30% (triggers every 30% gain from lowest low since ATH)
Price Sources:
ATH Tracking: High (ATH detection)
ATL Tracking: Low (low detection)
Buy Signal Source: Low (buy signals)
Sell Signal Source: High (sell signals)
Filter Options:
Apply Gann Filter: False (disabled by default)
Buy Sets ATL: False (disabled by default)
Display Options:
Show Buy/Sell Signals: True
Show Reference Lines: True
Show Info Table: False
Show Bar Type: False
How It Works
Buy Signals: Trigger every 10% drop from the all-time highest price reached
Sell Signals: Trigger every 30% increase from the lowest low since the most recent all-time high
Smart Tracking: Uses configurable price sources for signal generation
Key Features
Configurable Thresholds: Adjustable buy/sell percentage thresholds (default: 10%/30%)
Separate Price Sources: Independent sources for ATH tracking, ATL tracking, and signal triggers
Configurable Signals: Uses low for buy signals and high for sell signals by default
Optional Gann Filter: Apply Gann bar analysis for additional signal filtering
Optional Buy Sets ATL: Option to set ATL reference point when buy signals occur
Visual Debug: Detailed labels showing signal parameters and values
Usage Instructions
Apply to Chart: Use on any timeframe (recommended: 1D or higher for better signal quality)
Risk Management: Adjust thresholds based on your risk tolerance and market volatility
Signal Analysis: Monitor debug labels for detailed signal information and validation
Signal Logic
Buy signals are blocked when ATH increases to prevent buying at peaks
Sell signals are blocked when ATL decreases to prevent selling at lows
This ensures signals only trigger on subsequent bars, not the same bar that establishes new reference points
Buy Signals:
Calculate drop percentage from ATH to buy signal source
Trigger when drop reaches threshold increments (10%, 20%, 30%, etc.)
Always blocked on ATH bars to prevent buying at peaks
Optional: Also blocked on up/outside bars when Gann filter enabled
Sell Signals:
Calculate gain percentage from lowest low to sell signal source
Trigger when gain reaches threshold increments (30%, 60%, 90%, etc.)
Always blocked when ATL decreases to prevent selling at lows
Optional: Also blocked on down bars when Gann filter enabled
Limitations
Designed for trending markets; may generate many signals in sideways/ranging markets
Requires sufficient price movement to be effective
Not suitable for scalping or very short timeframes
Implementation Notes
Signals use optimistic price sources (low for buys, high for sells), these can be configured to be more conservative
Gann filter provides additional signal filtering based on bar types
Debug information available in data window for real-time analysis
Detailed labels on each signal show ATH, lowest low, buy level, sell level, and drop/gain percentages

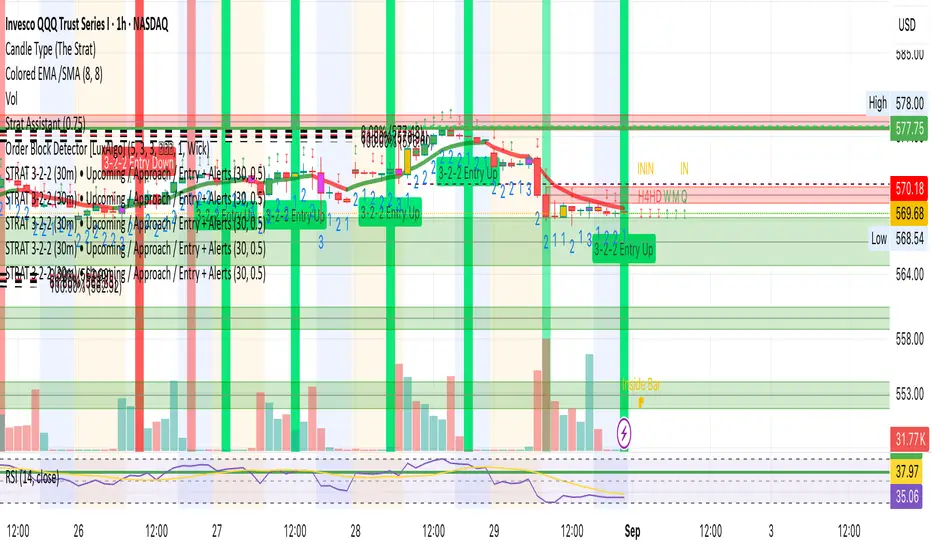
STRAT 3-2-2 (30m) • Upcoming / Approach / Entry + AlertsThis indicator is built for The STRAT trading method, specifically the 3-2-2 reversal pattern. It monitors price action on the 30-minute timeframe (HTF = 30m) and visually/alert-wise highlights where a 3-2-2 setup, approach, or entry trigger occurs.
---
⚙️ How it works
1. Detects bar types:
3 (Outside Bar) = range breaks both high & low of the previous bar
2u (Up bar) = higher high, not outside
2d (Down bar) = lower low, not outside
1 (Inside bar) = fully contained within prior bar
2. Looks for 3-2-2 setups:
Bullish 3-2-2 = 3 → 2d → 2u (expect reversal UP)
Bearish 3-2-2 = 3 → 2u → 2d (expect reversal DOWN)
3. Defines trigger levels:
Bullish trigger = high of the first “2d” bar
Bearish trigger = low of the first “2u” bar
4. Signals 3 phases:
Upcoming: pattern is forming, second “2” hasn’t triggered yet
Approach: price comes within 50% (adjustable) of the trigger level
Entry: price breaks the trigger (actual reversal confirmation)
5. Visualization:
Labels above/below candles show “Approach” and “Entry”
Background or bar colors (toggle in settings) highlight Setup / Approach / Entry
Optional dotted line marks the trigger level for clarity
---
🔔 Alerts
Two alert systems are built in:
1. Safe static conditions (for normal TradingView alert setup):
APPROACH: Bullish 3-2-2 (30m)
APPROACH: Bearish 3-2-2 (30m)
ENTRY: Bullish 3-2-2 (30m)
ENTRY: Bearish 3-2-2 (30m)
2. Dynamic messages (using alert() calls with price info):
If you create an alert with “Any alert() function call”, the pop-up will include the trigger price.
---
📋 Inputs (Settings)
Signal timeframe (HTF) → default 30m
Confirm signals at HTF bar close → waits for bar close (non-repainting)
Approach = % of first '2' bar range → default 50%
Show labels → On/Off
Color candles instead of background → toggle between candle color vs. chart background
Price Action All In OneThis indicator represents the most advanced level of price action indicators, incorporating six useful features: traditional gaps, shadow gaps, bar counting, moving averages, previous values, and IO pattern matching .
When I refer to price action, I mean the teachings of Dr. Al Brooks.
While you can find these features in other indicators, mine is more advanced. The default settings are designed to work on a 5-minute timeframe, but you can also use this indicator on other time periods if you prefer.
Gaps
Traditional Gaps: Occurs when the lowest price of a bar is higher than the highest price of the previous bar, or the highest price of a bar is lower than the lowest price of the previous bar.
Shadow/Tail Gaps: Occurs when the lowest price of a bar is higher than the highest price of the second last bar, or the highest price of a bar is lower than the lowest price of the second last bar.
Gaps indicate strength, and consecutive gaps in one direction are characteristic of a strong trend. They offer a perspective on the strength of a trend, signifying that limit orders on one side are at a loss with no opportunity to exit at breakeven. Can bulls or bears create gaps? Are the gaps they create filled, or do they remain open?
Traditional Gaps & Shadow/Tail Gaps
Bar Counting
The ability to use different timeframes (e.g., to determine the minute within an hour or the hour within a week).
Consistent display of 1; in other indicators, if you set intervals to 2, you see 2, 4, 6, etc., or 1, 2, 4, 6. In my indicator, you will see 1, 3, 5, etc.
In intraday trading, certain specific times are more important than others. For example, a form of reversal is more likely to occur at the midpoint of the trading day (if there are 80 candles in a day, the midpoint is at the 40th candle).
This doesn't mean you should make reversal trades at the 40th candle. The bar count feature simply reminds you of the current time, helping you gauge how long until the trading day ends. For instance, if there are 80 candles in a day and you're an intraday trader, you probably shouldn't make a swing trade at the 70th candle because there are only 10 candles left until the close—likely not enough time for a swing to develop.
Additionally, if you trade on a 5-minute timeframe, seeing candles numbered 3, 6, 9, etc. indicates the close of a 15-minute candle. This means that in addition to 5-minute timeframe traders, 15-minute timeframe traders will also pay attention to these candles, making them more significant. For the same reason, the 12th candle is crucial, as its close also marks the close of an hourly candle.
Day Time Frame & Week Time Frame
Moving Averages
Provides three EMAs. You can set different timeframes and choose between continuous or discrete modes.
Moving averages are excellent tools for determining trends. The 20 EMA is particularly popular, which increases its significance. Traders using different timeframes, such as 5-minute, 15-minute, and 1-hour, all utilize the 20 EMA. This indicator allows you to see what traders on 15-minute and 1-hour timeframes are observing, even when you're on a 5-minute timeframe.
Once again, the default settings of this indicator assume that the user is trading intraday on a 5-minute timeframe. However, if that's not the case, you can easily adjust the moving average periods. For instance, if you trade on a 1-hour timeframe and want to display the 4-hour and daily moving averages on your chart, this can be done effortlessly.
5m 20, 15m 20 & 1h 20
Previous Values
Features three previous value displays. You can set their sources and timeframes independently and define the range for all previous values.
For intraday trading, marking the previous day's high, low, and close prices can be crucial. While some other indicators provide this feature, mine does it better. You can set different timeframes and choose various sources. For example, you might want to display the average of (O+H+L+C)/4 for the last week.
In addition to setting the timeframe and source, you can also configure the display range:
All: This will show the data in all positions. For example, you can see the high price from two days ago on yesterday's chart.
Today: This will only display the previous day's high price on the current day's chart.
Timeframe: This will display the data based on the specified timeframe you set.
Last Week High, Last Day Close & Low(Timeframe Display)
IO Pattern Matching
More advanced than other IO pattern matching indicators. For adjacent IIs, it merges to display as III, IIII, and so on. The same applies to OO patterns. Additionally, it automatically merges adjacent IOI and II into IOII, and adjacent OO and IOI into IIOI.
II Pattern: This refers to two consecutive inside bar candles. On a lower timeframe, the II pattern forms a converging triangle, which is a breakout pattern. The II pattern could also potentially become a final flag, which is the last flag in a trend.
OO Pattern: This refers to two consecutive outside bar candles. On a lower timeframe, the OO pattern forms an expanding triangle. You can use the OO pattern similarly to how you would use an expanding triangle.
IOI Pattern: This pattern occurs when the first candle is contained within the second candle, and the third candle is also contained within the second candle. This is a breakout pattern and could similarly represent a terminal flag in a trend.
The appearance of II, OO, or IOI patterns does not necessarily mean you should make a reversal trade. These patterns are meant to mark potential moves in a lower timeframe within the current cycle, providing a new perspective on the market and reminding you to stay vigilant.
You shouldn't look for IO patterns in a tight trading range. There are many IO patterns in a tight trading range, but they don't hold much significance.
II, OO & IOI

Brooks Always In [KintsugiTrading]Brooks Always In
Overview:
The "Brooks Always In Indicator" by KintsugiTrading is a tool designed for traders who follow price action methodologies inspired by Al Brooks. This indicator identifies key bar patterns and breakouts, plots an Exponential Moving Average (EMA), and highlights consecutive bullish and bearish bars. It is intended to assist traders in making informed decisions based on price action dynamics.
Features:
Consecutive Bar Patterns:
Identifies and highlights consecutive bullish and bearish bars.
Differentiates between bars that are above/below the EMA and those that are not.
Customizable EMA:
Option to display an Exponential Moving Average (EMA) with user-defined length and offset.
The EMA can be smoothed using various methods such as SMA, EMA, SMMA (RMA), WMA, and VWMA.
Breakout Patterns:
Recognizes bullish and bearish breakout bars and outside bars.
Tracks inside bars and prior bar conditions to better understand the market context.
Customizable Display:
Users can display or hide the EMA, consecutive bar patterns, and consecutive bars relative to the moving average.
How to Use:
Customize Settings:
First, I like to navigate to the top right corner of the chart (bolt icon), and change both the bull and bear body color to match the background (white/black) - this helps the user visualize the indicator far better.
Next, Toggle to display EMA, consecutive bar patterns, and consecutive bars relative to the moving average using the provided input options.
Adjust the EMA length, source, and offset as per your trading strategy.
Select the smoothing method and length for the EMA if desired.
Analyze Key Patterns:
Observe the highlighted bars on the chart to identify consecutive bullish and bearish patterns.
Use the plotted EMA to gauge the general trend and analyze the relationship between price bars and the moving average.
Informed Decision Making:
Utilize the identified bar patterns and breakouts to make informed trading decisions, such as identifying potential entry and exit points based on price action dynamics.
Good luck with your trading!

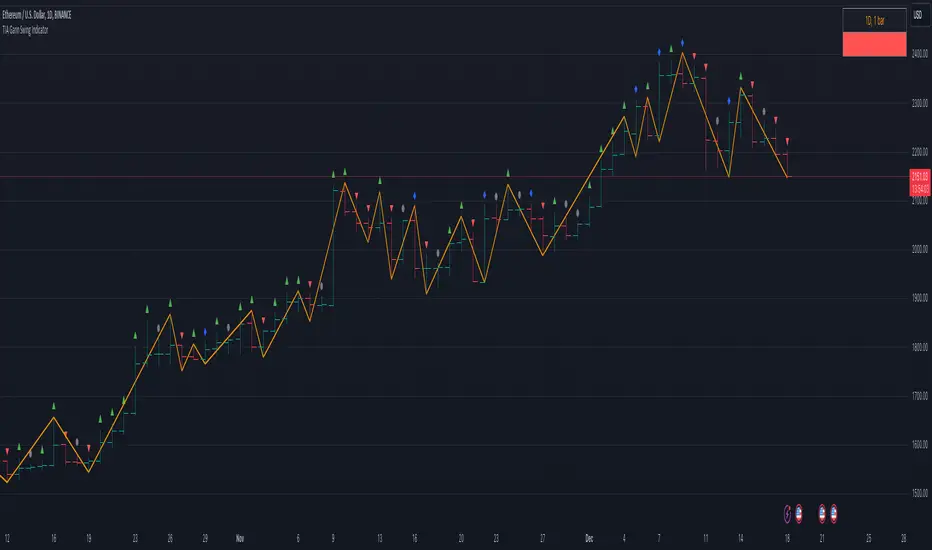
TIA Gann Swing IndicatorTIA Gann Swing Indicator
This indicator is a mechanical tool that tells the user exactly what the market trend is at any time, based on the teachings of Legendary trader, Mr. William D. Gann .
Gann called this tool the “Trendline Indicator,” but it has popularly become known as the “Swing Chart” by present-day traders.
In October 1909, Richard Wyckoff watched Gann for 25 market days (the markets traded on Saturdays back then), where Gann made 286 trades, both long and short. Two hundred sixty-four (264) of these trades were profits.
The Swing Chart was Gann’s primary trading tool helping him achieve these phenomenal trading results.
This indicator, now available to you in TradingView, automatically displays the swing chart and trend on any timeframe.
Selecting “Show Trend,” will light the background of the chart up, showing if the trend is “Up,” “Down,” or “Uncertain.”
The indicator is also fully customizable to display “Break Lines,” which indicate potential trend changes ahead of time.
Additional features include data about each bar and swing to give the user vital information, and the data points currently available include:
Bar Type
This indicator selection allows the user to identify precisely what each bar is, as per WD Gann’s Instructions.
Each of the 4 bar types includes:
Up bars, Down bars, Inside bars, Outside bars
Date
Displaying the date of swing tops and bottoms allows the user to stay on top of significant announcements and events in the economy. Often, market reversals occur right around critical economic events.
Time
This indicator selection allows the user to identify the time of the swing tops and swing bottoms. Designed for intra-day traders, this setting displays the exact time of tops and bottoms on any timeframe to help stay ahead of any important announcement.
Price
Price analysis is critical for every technical analyst, and displaying the price of swing tops and bottoms allows the trader or investor to stay on top of essential pivot points in the market. Identifying potential support and resistance levels keeps traders ahead of the herd.
Range
Identifying each swing’s price range gives the trader or investor critical information. Have you ever wondered if a market is gaining momentum or losing momentum? Knowing if price ranges are expanding or contracting is key, and this setting quickly displays what every swing range is doing.
Bar Count
What is the average number of bars up or down? Markets can only move in one direction for so many bars before a reversal. Simply displaying the number of bars between each swing gives the analyst valuable insights into overbought or oversold trends. Gann's famous “7-10 bar” rule identifies potential reversals, and this simple indicator setting can help any market participant stay ahead of the pack.
The TIA Gann Swing Indicator is an indicator that EVERY trader & investor should have at their fingertips. It is critical for long-term investors and short-term traders to know the trend of their market and vital information about the upswings and downswings. The TIA Gann Swing Indicator is the indicator to help.
See the Author's instructions below to get access to this package.
Pua CandlesPua Candles Indicator
Named after "Pua," the Hawaiian word for flower, this indicator identifies small, delicate price movements that often precede significant market expansion. Like tiny flowers that can bloom into something magnificent, Pua candles represent seemingly insignificant moments that frequently mark exhaustion areas in the market.
Pua candles are both inside bars (contained within the previous bar's range) and small relative to the ATR threshold. These quiet, compressed price actions often signal consolidation before major moves. When price eventually expands beyond these delicate formations, it can lead to substantial directional movement.
The indicator highlights bullish Pua candles in teal and bearish ones in pink, making these critical junctures easy to spot. Pay special attention to follow-through action after Pua candles - they often mark the calm before the storm.
Features:
Identifies inside bars with small ATR-relative ranges
Customizable ATR period and smallness threshold
Visual highlighting with Hawaiian-inspired colors
Alert notifications for Pua formations and follow-through
No repainting - confirmed signals only
Perfect for spotting potential breakout setups and market turning points.
******Make sure you go to visual order settings and bring to front******

Day 3 PlayDay 3 Play — Indicator Summary
The Day 3 Play indicator is designed to identify outsized moves on Day 1 with a consolidation on Day 2 and are primed for a breakout on Day 3.
Day-1: A stock makes an outsized move (configurable, default = ±3% from prior close) on above-average relative volume (default = ≥3× 30-day average).
Day-2: The stock consolidates inside the Day-1 range (an inside bar).
Day-3: Price is primed for a breakout beyond the Day-2 high (bullish) or Day-2 low (bearish).
How It Works in the Pine Screener
The script computes Day-1 moves, Day-2 ranges, and checks volume requirements in the daily timeframe.
In the Screener, add a watchlist that includes your custom list of stocks. Then, add the custom Day 3 Play indicator. Select the time frame and the parameters from the indicator.
Screener columns (hidden by default) report whether a setup is found, whether it’s bullish or bearish, and the precise trigger/offset levels.
Alerts and Offsets
Alerts are available for:
Breakout at the Day-2 high/low (the trigger).
Approaching within an offset (configurable, default = 0.25%) from the Day-2 high or low.
This lets you catch moves as they’re forming intraday, even in extended hours, and not just after the breakout occurs.
Customization
Thresholds: Adjust the Day-1 % move (default 3%) and minimum relative volume (default 3×).
Alert Offset: Change the proximity level (default 0.25%) where alerts should fire before the breakout.
Visibility: Toggle chart lines (levels and offsets) and a debug panel separately.
Lookback: Control how many past days are scanned for the most recent valid setup.
On-Chart Levels
Day-2 High/Low: Shown as reference levels.
Bull/Bear Level: The breakout level (Day-2 high or low depending on setup).
Alert Offset Lines: Offset from the breakout level by your chosen % for early alerts.
Key Calculations
Relative Volume (RVOL): Day-1 volume ÷ 30-day average (excluding the day itself).
Inside Bar: Day-2 high ≤ Day-1 high and Day-2 low ≥ Day-1 low.
Breakout Levels:
Bullish = Day-2 High (with offset below).
Bearish = Day-2 Low (with offset above).

Cnagda Liquidit Trading SystemCnagda Liquidit Trading System helps spot where price is likely to trap traders and reverse, then gives simple, actionable Level to entry, place SL, and take profits with confidence. It blends imbalance zones, trend bias, order blocks, liquidity pools, high-probability fake Signal, and context-aware candle patterns into one clean workflow.
🟩🟥 Imbalance boxes: “Crowd rushed, gaps left”
What it is: Green/red boxes mark fast, one-sided moves where price “skipped” orders—think FVG-like zones that often get revisited.
Why it helps: Price frequently pulls back to “fill” these zones, creating clean retest entries with logical stops.
⏩How to use:
Green box = potential demand retest; Red box = potential supply retest. Enter on pullback into box, not on first impulse. Put stop on far side of box and aim first targets at recent swing points.
↕️ Swing bias (HH/HL vs LH/LL): “Which way is the road?”
What it is: Higher-highs/higher-lows = up-bias; Lower-highs/lower-lows = down-bias. system plots Buy/Sell OB levels aligned with that bias.
Why it helps: Trading with the broader flow reduces “hero trades” against institutions. Bias gives clearer entries and cleaner drawdowns.
⏩How to use:
Up-bias: look for long on Buy OB retests. Down-bias: look for short on Sell OB retests. Wait for a small rejection/engulfing to confirm before triggering.
🧱Order blocks: “Where big players remember”
What it is: last opposite-colored candle before an impulsive move—these zones often hold memory and reaction. system plots these as Buy/Sell OB lines.
Why it helps: Many breakouts pull back to the origin. Good entries often happen on retest, not on the breakout chase.
⏩ How to use:
Let price return into the OB, show wick rejection, and decent volume. Enter with stop beyond OB; define risk-reward before entry.
📊Volume coloring: “How Volume is move?”
What it is: Bar color reflects relative volume; inside bars are black. The dashboard also shows Volume and “Volume vs Prev.”
Why it helps: Patterns without volume often fade; volume validates strength and intent of moves.
⏩ How to use:
Favor entries where imbalance/OB/liquidity-grab coincide with higher volume. If volume is weak, reduce size or skip.
🧲 BSL/SSL liquidity pools: “Fishing for stops”
What it is: Equal highs cluster stops above (BSL); equal lows cluster stops below (SSL). system plots these and highlights the nearest one (“magnet”).
Why it helps: Price often sweeps these pools to trigger stops before reversing. This is a prime trap-reversal location.
⏩ How to use:
Watch nearest BSL/SSL. If price wicks through and closes back inside, anticipate a reversal. Trade reaction, not first poke. When price closes beyond, consider that pool mitigated and move on.
🟢🔴 Advanced liquidity grab: “Catch fakeout”
What it is: Bullish grab = makes a new low beyond a prior low but closes back above it, with a long lower wick, small body, and higher volume. Bearish is mirror. Labeled automatically.
Why it helps: It exposes trap moves (stop hunts) and often precedes true direction.
⏩ How to use:
Best when it aligns with a nearby imbalance/OB and supportive volume. Enter on reversal candle break or on retest. Stop goes beyond sweep wick.
🧠 Smart candlestick patterns (only in right place)
What it is: Engulfing, Hammer, Shooting Star, Hanging Man, Doji (with high volume), Morning/Evening Star, Piercing—but marked “effective” only if context (swing/trend/location) agrees.
Why it helps: same pattern in the wrong place is noise; in the right place, it’s signal.
⏩ How to use:
Location first (BSL/SSL/OB/imbalance), then pattern. Treat pattern as trigger/confirmation—one fresh label shows to keep chart clean.
🧭 Dashboard: “Context in a glance”
⏩ Reversal Level: current swing anchor—expect turns or reactions nearby; great for alerts and planning.
⏩ Volume vs Prev + Volume: Strength meter for signal candle—higher adds conviction.
⏩ Nearest Pool: next “magnet” area—look for sweeps/rejections there.
🧩Step-by-step trading flow (with mindset)
⏩ Set bias: HH/HL = long bias, LH/LL = short bias. Counter-trend only on clean sweeps with strong confirmation.
⏩ Find magnet: Check Nearest Pool (BSL/SSL). Focus attention there; it saves screen time.
⏩ Wait for event: Look for a sweep/grab label, or sharp rejection at pool/OB/imbalance. Avoid FOMO.
⏩ Add confluence: Stack 2–3 of these—imbalance box, OB, contextual pattern, supportive volume.
⏩Plan entry: Bullish: trigger above reversal candle high or take retest of FVG/OB. Stop below sweep wick/zone. Target at least 1:1.5–1:2.
Bearish: mirror above.
⏩Manage smartly: Take partials, move to breakeven or trail thoughtfully. Don’t drag stops inside zone out of emotion.
🎛️ Parameter tuning (to reduce human error)
⏩ swingLen: Smaller = faster but noisier; larger = cleaner but slower. Backtest first, then go live.
⏩ Tolerance (ATR or percent): ATR tolerance adapts to volatility (good for fast markets and lower TFs). Start around 0.15–0.30. In calm markets, try percent 0.05–0.15%.
⏩ minBarsGap: Start with 3–5 so equal highs/lows are truly equal—reduces false pools.
❌Common mistakes → ✅ Better habits
⏩Chasing every breakout → Wait for sweep/rejection, then confirm.
⏩Ignoring volume → Validate strength; cut size or skip on weak volume.
⏩Losing history of pools → If reviewing/backtesting, keep mitigated pools visible (dashed/faded).
⏩Over-tight tolerance/too small swingLen → Increases false signals; backtest to find balance.
📝 checklist (before entry)
⏩ Is there a nearby BSL/SSL and did a sweep/grab happen there?
⏩ Is there a close imbalance/OB that price can retest?
⏩ Do we have an effective pattern plus supportive volume?
⏩Is the stop beyond the wick/zone and RR ≥ 1:1.5?
•?((¯°·._.• 🎀 𝐻𝒶𝓅𝓅𝓎 𝒯𝓇𝒶𝒹𝒾𝓃𝑔 🎀 •._.·°¯((?•

Higher Timeframe Candles (Dynamic Display)Key Features:
1. Higher Timeframe Candles Visualization:
Displays up to 5 candles from a user-selected higher timeframe (e.g., 15-minute, hourly).
Each candle includes:
Body (open-close range) and wicks (high-low range).
Customizable appearance settings for width, colors, and transparency.
2. Horizontal Price Levels:
Calculates and plots important levels based on the higher timeframe candles:
Max High: Highest price among the displayed candles.
Min Low: Lowest price among the displayed candles.
Midpoint: The midpoint between Max High and Min Low.
Quarter Points: 25% and 75% levels within the Max-Min range.
Each level's line appearance (color, width, style) can be customized, and price labels can be displayed.
3. Fair Value Gaps (FVG):
Detects bullish and bearish fair value gaps (FVGs) based on three consecutive candles:
Bullish FVG: Middle candle's low is higher than the previous candle's high.
Bearish FVG: Middle candle's high is lower than the previous candle's low.
Highlights FVGs with colored boxes and optional labels showing gap height.
4. Inside/Outside Bar Detection:
Identifies inside bars (current candle is entirely within the previous candle) and outside bars (current candle exceeds the previous candle's range).
Labels these patterns above the candles for easy identification.
5. Alerts for Key Levels:
Alerts are triggered when the current price crosses:
Max High
Min Low
Midpoint
Alerts help traders act without monitoring the chart constantly.
6. Customization Options:
Fully customizable input options for candles, levels, FVGs, and labels:
Appearance settings: Colors, widths, styles, transparency.
Toggle visibility for specific features (e.g., FVGs, labels, quarter points).
Label precision and positioning.
